
In the previous article in this series, we discussed how to understand the various road maintenance costs that go into your road management process including the repair and rebuilding of unpaved versus paved roads.
Midwest has developed a proprietary method for achieving the pros of both paved and unpaved roads, while minimizing the cons of both, based on our latest research and on emerging trends in the industry.
We left off at the end of the previous article in the series with the extreme financial pressures that force a downward cycle on road managers. We concluded by stating that there are two vital steps you can take to stretch your maintenance budget and get more results for every dollar spent. And that’s where we’ll pick up here.
Step 1: Create Your Road Management Process
The first step is to develop and/or optimize your road management process. In a study of nine towns in New York, none of the towns had a formal, multi-year program in place. And in another study conducted in Wyoming, as of 2017, there were no optimization programs for the unpaved roads that make up two-thirds of the state’s road system.
Optimizing your road management process takes something that may be somewhat haphazard at the moment and organizes it. You create a system for systematically understanding your roads and their needs. And you have a program in place that helps you prioritize needs and allocate budget. Most importantly, you significantly reduce surprises.
To give you an idea how you might go about setting up a system like this (something Midwest can help you with), we’ll refer back to the Wyoming study. Here are the steps they took.
First, they created a list of possible treatment options with the associated cost per square yard (and extrapolated cost per mile, based on a road that is 24 feet wide). Here’s that list:
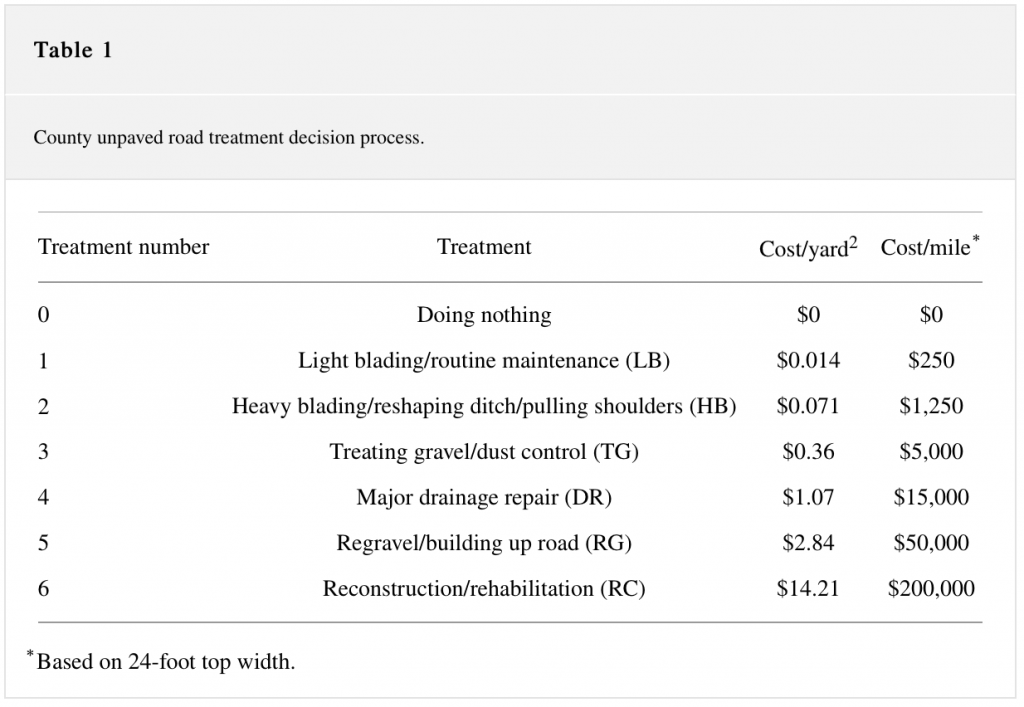
Next, they created a list of possible distresses (e.g., cross section, roadside drainage, rutting, dust, etc.), along with possible conditions (i.e., from failed to very good). These ratings ran down the x axis of a chart, while the service level (i.e., volume of traffic, ranked from very high to none) ran across the y axis.
At each intersection of a distress and condition with the applicable service level, a code for the most relevant treatment type was given. For example, in the Rutting – Failed category, for a road with a very high (>400 vehicles per day) traffic volume, reconstruction is recommended. For Potholes – Poor, the same service level requires re-graveling. (You can check out the complete table here.)
The next stage is where the heavy research comes in. The researchers put together a sample list of road segments for the study (segments begin and end with new construction, intersections with other roads or other changes in the road). For each segment, the length of that road segment was provided. The corresponding traffic volume and road width for each segment was then determined.
Finally, each road segment was given a condition rating for each type of distress (rutting, potholes, etc.).
In the next stage, these condition and distress ratings were merged to create one simplified rating for each segment. Then, each segment was assessed after 90 days of no treatment and given a revised rating, to determine the effect of not treating the problems. Each segment was also assigned a service level and a treatment type (based on the overall condition). Then, using the treatment type and segment length, a list of projected costs was developed.
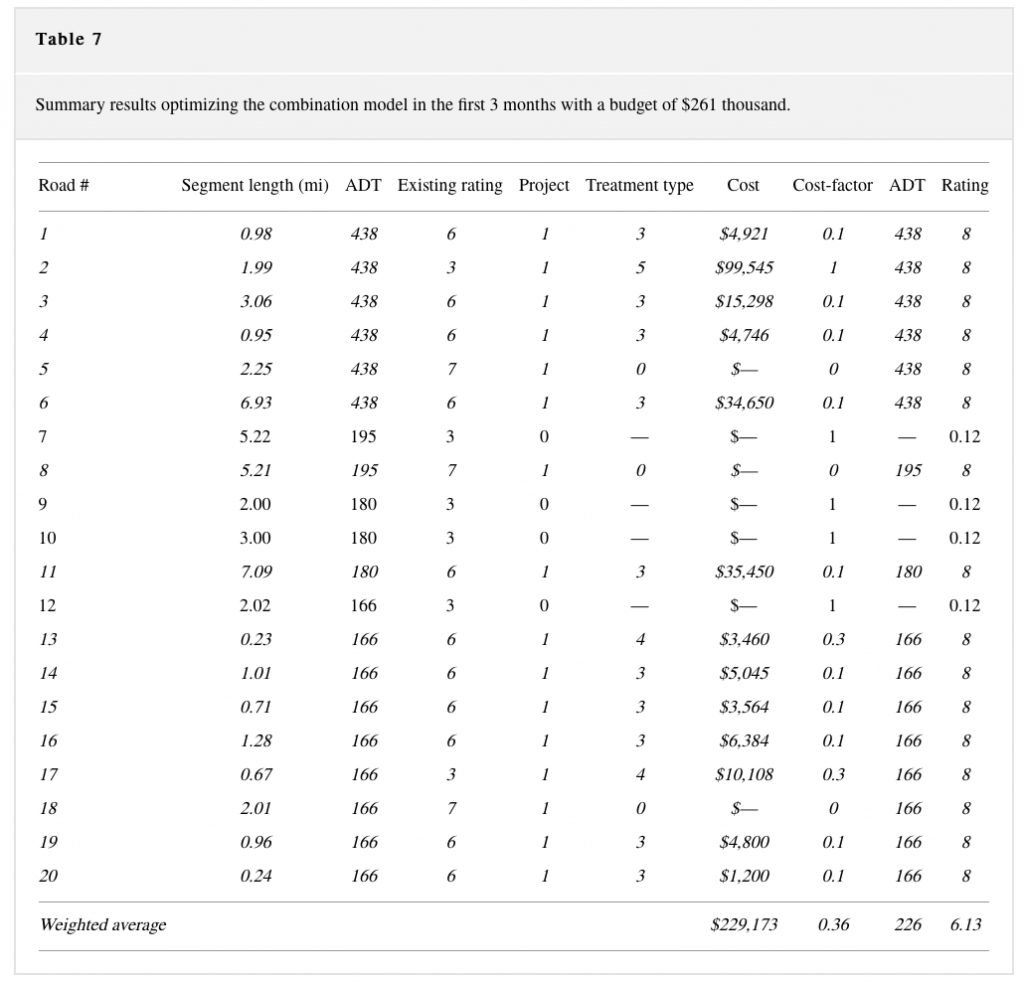
For example, the first road segment was .98 miles, had an overall condition rating of six and the service level was very high. Based on this, the assigned treatment was type three, treating gravel/dust control. The cost of this in the first table, $5,000 per mile, was applied to the .98 mile length, making the total cost for this road segment $5,000 times .98, or about $4,900.
(Check out the table for these results here.)
Finally, the post-treatment condition was evaluated and the new condition rating assigned. (In the above example, the condition rating of six was raised to a new level of eight through the treatment.)
As a result of this analysis, they were able to prioritize treatments based on their quarterly budget. They allocated their budget as they could, chose which projects to postpone until later in the year and, meanwhile, were able to determine what the effect on those postponed projects would be to prepare accordingly for the future. Here’s how that final assessment looked:
An additional result of their efforts was that there was a cumulative positive effect on the roads. With each passing quarter, the cost factor (based on treatment type), average daily traffic volume and overall condition rating improved over the past.
So developing and/or optimizing your road management process is step one. You’ll probably have a number of tweaks you make to this system described above to make it relevant to your situation, but it gives you a model to see how it can be done.
Step 2: Prioritize Dust Control and Road Stabilization
The second step to stretch your maintenance dollars further is to prioritize dust control and road stabilization efforts.
Why? Because an effective dust control and road stabilization program cuts your carrying costs, reduces the chances of (or even eliminates) needing to upgrade a road segment and creates a cumulative, upward cycle of positive results that build on positive results year after year.
Whether you’re thinking of upgrading a gravel road to a paved one, thinking of downgrading a paved one into gravel or just wanting to better manage the gravel roads you have now, utilizing effective dust control and road stabilization can create a road with the low overall carrying costs of a gravel road but with the strength and durability of a paved road.
(Hint: this is the big idea we’ve been talking about throughout this series. Midwest has developed a proprietary method around this idea that you can build a road with low carrying costs, like a gravel road, but with the durability of a paved road. We’re the first to do so; but don’t take our word for it – check out the data below.)
Let’s look at this in action.
Going back to the calculator discussed in the previous article (here), if you calculate the total costs, including both initial building and ongoing carrying costs, gravel and paved road costs come out looking pretty close. Over a 20-year cycle, gravel is only about $24,000 cheaper.
But when you compare the costs of a gravel road alone with a gravel road that utilizes dust control, maintenance costs drop significantly as the frequency of maintenance drops. And adding in road stabilization causes that frequency to drop even further.
Over 20 years, a gravel road with both dust control and stabilization saves $150,000 compared to a paved road. That’s about six times the savings over gravel alone.
But the calculator fails to show the cumulative effect of a solid road management process over time.
In our experience at Midwest, a good program sees results that get better with age. The right product binds the fines (dust particles that hold larger aggregate together) to the road surface in such a way that increased traffic actually increases the strength of the road over time. This both improves the performance of the road today and extends the lifecycle of the road in the long-term.
But beyond any particular product, a holistic program takes into account the specific factors at play on your roads, recommends the right mix of products to get the results you’re seeking, then tracks results to prove the success of the program. This level of customization means that you can actually watch as, with every application, your desired metrics get better over time.
The results are undeniable:
- Roads require far less maintenance than gravel alone ever could
- Fines are suppressed, allowing the road to remain its “as-constructed” quality far longer
- The road surface gains strength with time, as it is compressed with use
- Gravel roads achieve the strength and durability of paved roads, but still have lower carrying costs
- Costly reconstruction and renewal costs are eliminated or significantly reduced
- Expensive upgrade projects are avoided entirely, or pushed much further into the future, as roads can now withstand a larger traffic volume
- And all of the other costs of fugitive dust, on surrounding communities, people’s health and the environment, are greatly minimized
In the assessment of the Iowa study referenced in the previous article, the only way to cope with the funding problems we’ve been talking about is through either higher taxes or downgraded roads – which, to the study authors, means lower quality.
But at Midwest, we believe there’s a third way, a way that “downgraded” roads actually have all of the pros of both gravel and paved roads, but none of the cons. We’ve seen this happen with clients in the past and would love to talk with you about your current road management process to see if we can help you get the same results. We can help you create an optimized road management process to better visualize and plan for the future. Then we can help you implement an effective dust control and road stabilization program that will bring your costs down and lengthen the life of your roads.